


SI8000 Cell Motion Imaging System
Cardio Model Applications
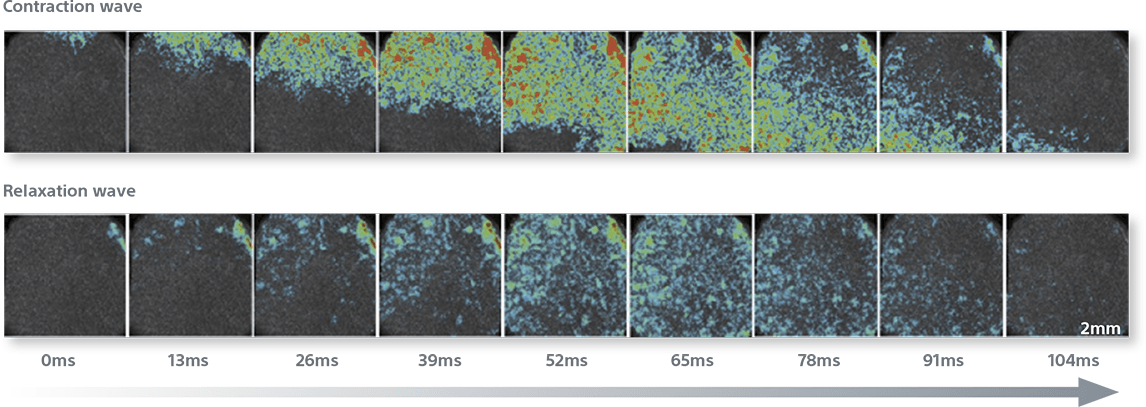
Label-free visualization of contraction propagation in cardiomyocyte monolayer
Magnitude of all motion vectors detected for the whole image (2048×2048 pixels) is shown with a heat map. Upper panels represent contraction wave and lower panels are relaxation wave. The interval of each picture is 13ms. The field of view is 4mm×4mm. This type of quantification makes the SI8000 an ideal system for measuring and quantifying torsadogenic risk in drugs or compounds offering a much deeper understanding of cardiovascular risk.
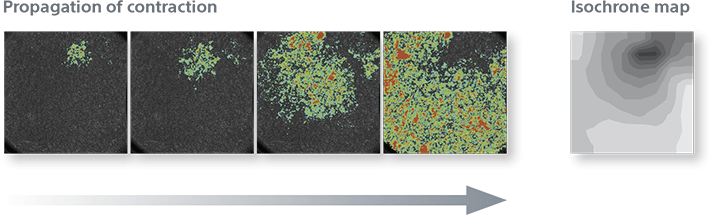
The SI8000 accurately quantifies the propagation of the contraction wave (top panel) and relaxation wave (middle panel). Analyzing the contraction and propagation wave allows for a precise quantification of the propagation of the contraction (bottom panel).
Contractile motion of single ventricular cardiomyocyte
Ventricular cardiomyocytes were paced via an external stimulator and their beat profile was modified as expected via the application of the beta-adrenergic agonist, Isoproterenol, which is known to increase heart rate. The application of Isoproterenol increased maximum contraction velocity, maximum relaxation velocity, and average deformation distance while decreasing beat duration (analogous to field potential duration). These results demonstrate the power of the SI8000 to detect pharmacological effects of compounds label free with high spatial and temporal resolution providing deeper data quality.
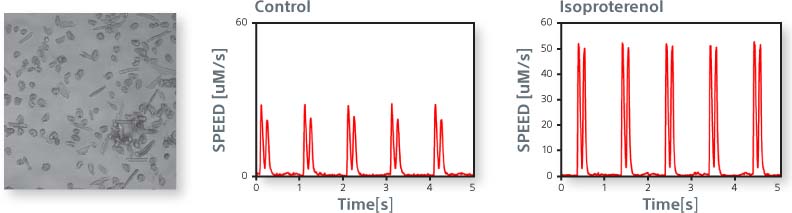
The image on the left shows isolated primary ventricular cardiomyocytes. The beat profile is obtained under control conditions (center) and in response to Isoproterenol (right).
Contractile motion of single ventricular cardiomyocyte
Ventricular cardiomyocytes were paced via an external stimulator and their beat profile was modified as expected via the application of the calcium channel blocker, Verapamil, which is known to slow heart rate. The application of Verapamil decreased maximum contraction velocity, maximum relaxation velocity, and average deformation distance while decreasing beat duration (analogous to field potential duration). Results demonstrate how the SI8000 can detect pharmacological effects of compounds label free with high spatial and temporal resolution providing precise data.
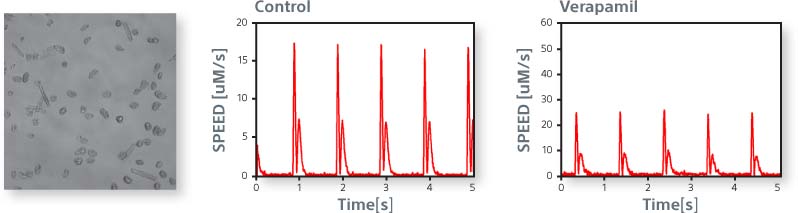
The image on the left shows isolated primary ventricular cardiomyocytes. The beat profile is obtained under control conditions (center) and in response to Verapamil (right).
Research Model Applications
Cell viability assay with human iPS cell derived neural cell
The SI8000 can measure the motion of neurons. The Power Spectral Density (PSD) of a neuron's motion can be used to accurately predict cell death. The PSD represents the strength of a cell's motion in the frequency domain. The figures below show how the PSD of a neuron culture can be used to predict cell death much more precisely than traditional survivability measures.
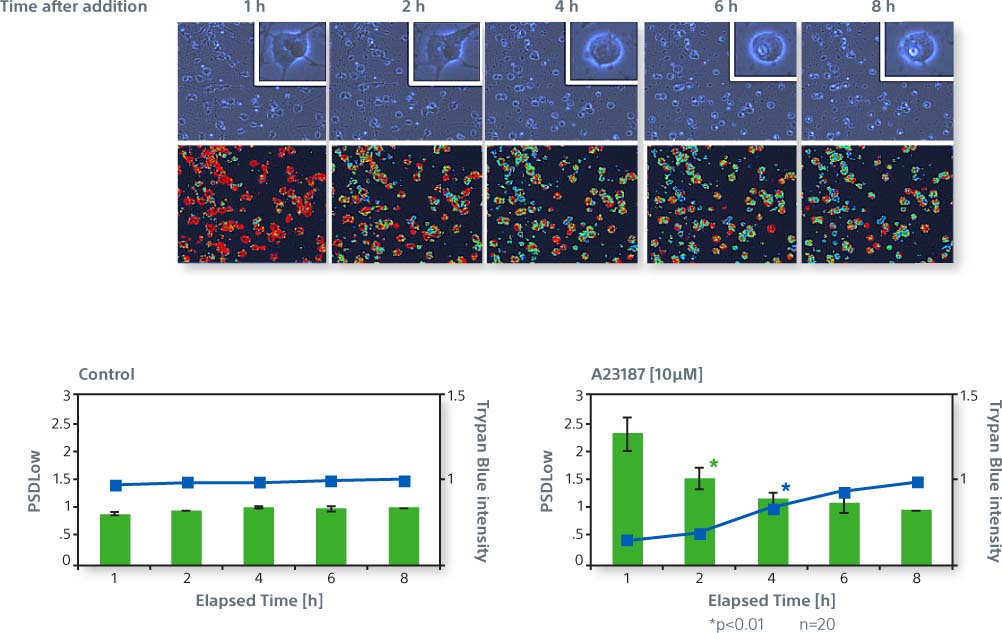
iPS derived neural cells (iCell Neuron) Cell death was induced by adding 10 μmol/L of Ca2+ ionophore A23187. Cell death was analyzed by adding 0.01% of Trypan blue (top). Graph (bottom) a comparison of the Trypan blue cell death analysis (line) and the PSD (bars). The graph on the bottom right shows a comparison of Trypan blue cell death analysis (line) and PSD (bars) 1 – 8 hours after applying Ca2+ ionophore. The PSD analysis of the SI8000 more reliably predicts cell death than the more traditional measure of Trypan blue cell death analysis, offering a deeper understanding of the data.
Migration Assay with human cancer cell
The SI8000 is suited for cellular migration assays using time lapse imaging. By measuring migration speed and migration distance, a deep understanding of cellular motion is possible. HeLa cells (human cervical cancer cells) migration is demonstrated in the images below.
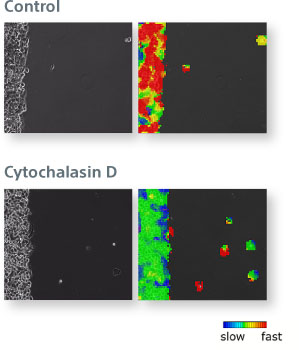
HeLa cells demonstrate the migration assay capabilities of the SI8000. The speed of migration under control conditions (top) and heat map of cellular motion where relatively fast speeds are represented by red and slow speeds by blue (right). Cellular migration slows in response to Cytochalasin D (anti-cancer agent) (bottom).
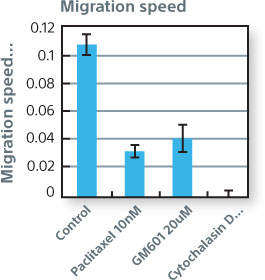
The bar graph represents migration speed under control conditions and in response to the anti-cancer agents Paclitaxel, GM601, and Cytochalasin. Migration speed significantly reduced in response to all anti-cancer agents. This data indicates that the SI8000 offers precise data analysis of cellular migration.
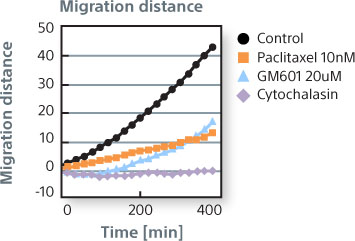
The line graph represents migration distance under control conditions and in response to the anti-cancer agents Paclitaxel, GM601, and Cytochalasin. Migration distance significantly decreased over time in response to all anti-cancer agents. This data indicates that the SI8000 offers a deep understanding of data for cellular migration.
Monitoring blood flow in Zebrafish Larva
Using a high speed video camera, the SI8000 tracked the development of blood flow in Zebra Fish Larvae. Below shows the velocity of motion of blood flow (color) from very little (early day 1) to nearly mature (third day of larval stage.)
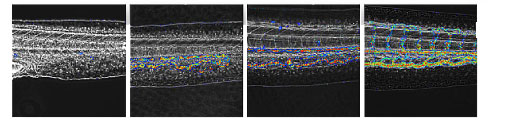
The color in the images above represent the speed of blood flow in four stages of Zebra Fish larvae development. The red color represents relatively fast blood flow and the blue represents slow. Blood flow increases as a function of development. The ability to quantify subtle differences in blood flow demonstrates the precision and depth of data that is possible with the SI8000.