


ID7000™ Spectral Cell Analyzer
Designed for True Ease of Use
The ID7000 system software is easy to learn and use. It guides researchers from setup and QC to panel design, data acquisition, data analysis, through system shutdown. For accommodating users with varied experience levels, most workflows are designed with an expert mode and a guided mode. In guided mode, software wizards simplify system operation. The software provides access levels and tools to suit the needs of busy laboratories. Preferences allow users and administrators to specify options for overall instrument operation and experimental setup to facilitate use of the ID7000 spectral cell analyzer. It is also possible to configure software preference settings for each individual user for added convenience.
Intuitive Workflows for Acquisition and Analysis
In the ID7000 system software, users can create experiments from a template, an existing experiment, a single-stained sample, or a multicolor assay to accommodate their preferred approaches. New users can create new experiments with the Experiment Design Wizard. To accommodate multi-sample and multiparameter experiment needs, the ID7000 software provides both a Shared Worksheet and an Individual Worksheet. A Shared Worksheet allows each sample in a group to use the same worksheet and thus makes experiment setup more intuitive.
Instrument settings can be specified for each sample group and configured for lasers and detectors to give researchers the needed flexibility. Altering these settings for a sample in a group changes the settings for all unmeasured samples belonging to the same group. Instrument settings can be exported and imported
as needed.
The acquisition functions are all accessible from the Acquisition tab and have been developed keeping a multi-laser workflow in mind. The tab accesses all functions that control the data acquisition, recording, and stopping, as appropriate, while monitoring the data acquisition status. To enable walkaway functionality, the system has an Event Checking function that can be set to stop or skip and continue automatic acquisition if the event rate drops or air bubbles are detected.
For sample analysis, the appropriate spectral references must be selected and fluorescence unmixing applied to remove the spillover components from each fluorescence channel. The unmixing can be manually adjusted on the screen using the Spectral Reference Adjuster. Making changes on one plot will result in the changes being applied automatically to all other plots having that fluorochrome as one of their parameters. Users can save the adjustment result as a new fluorescence unmixing matrix or can overwrite an existing fluorescence unmixing matrix.
The Analysis tab houses all controls for analysis operations on the ID7000 spectral flow cytometer, providing access to worksheet tools that let users choose how the data is displayed (such as plot types), and customize the display for their analysis needs. Plots and statistics provide real-time information during acquisition. The Experiment Explorer pane allows search by date and keyword, to display desired data on the worksheet. Once displayed, plots can be edited individually or as a group, to facilitate working with complex gating hierarchies.
The software also supports batch processes for users who need to run multiple samples, for operations like experiment setup, data acquisition and analysis, and export of data and statistics. Combined with the ability to program an automated shutdown, this enables scientists to focus on discovery instead of repetitive tasks.
Automated Setup and Quality Control to Ensure System Performance
At startup, the Align Check and Performance QC wizards use beads to check instrument calibrations, to ensure the instrument is operating optimally. On-screen instructions guide the user through procedures, then display progress and report results. The QC results are available as a report that can be shared and archived. Trends over a desired period of time can also be displayed to ensure that the system performance is consistent as expected.
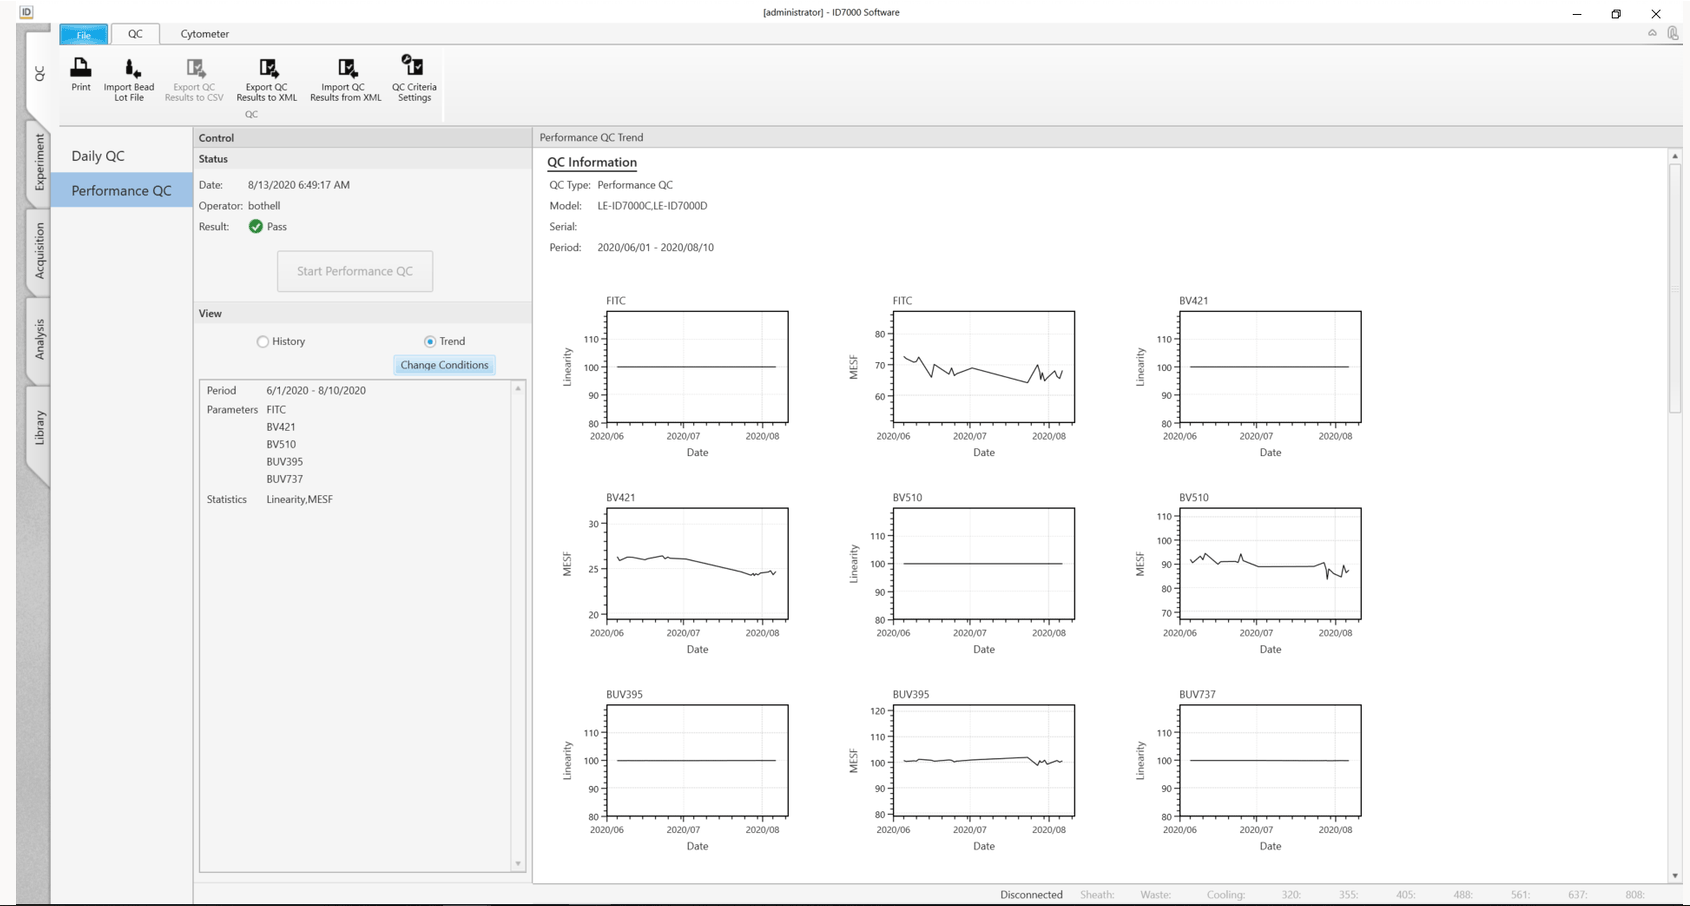
QC results for the system are tracked over time using the History and Trend views in the QC tab of the system software.
The History view displays the instrument performance results for each day, while the Trend view tracks instrument performance (such as linearity and MESF) over time as Levey-Jennings plots.
The Performance metrics are customizable and provide a convenient way to view performance results, spot trends, and measure variation over time, maintaining instrument settings for highly reproducible results.
Acquisition Window
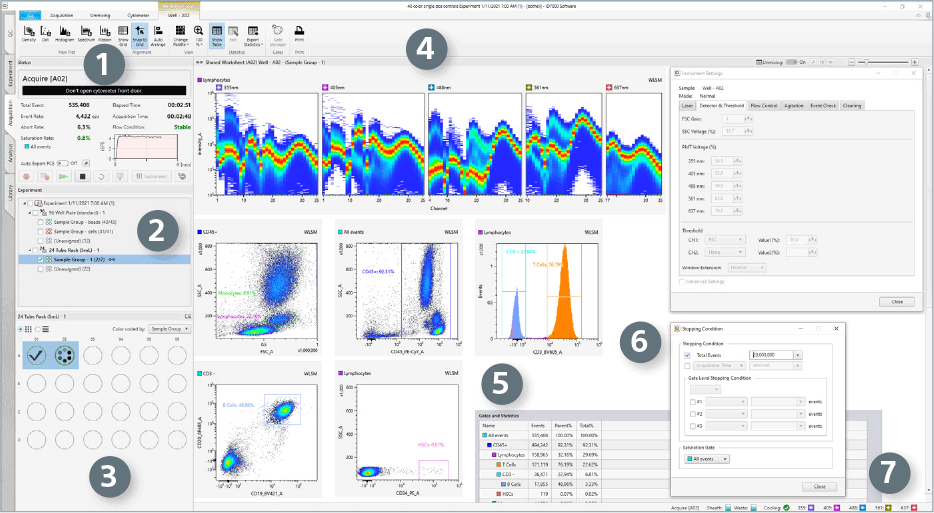
Selecting the Acquisition workflow tab displays information required for managing sample acquisition.
- Acquire/Status Pane displays parameters for data acquisition and includes the functionalities to manage sample acquisition, including setting up auto export.
- Experiment Pane displays available experiments/templates and the organization structure of the experiment.
- Sample Layout (Plate) Panel displays the visual of the chosen layout for the sample acquisition format. Allows for visual indication of completion of acquisition and inclusion in sample groups.
- Workspace for Plots
- Gates and Statistics displays statistics calculated automatically from acquired data.
- Stopping Condition Window allows usersto specify data acquisition stopping criteria.
- Persistent Footer allows users to monitor the status of optics (Lasers) and Fluidics (Sheath and Waste).
Analysis Window
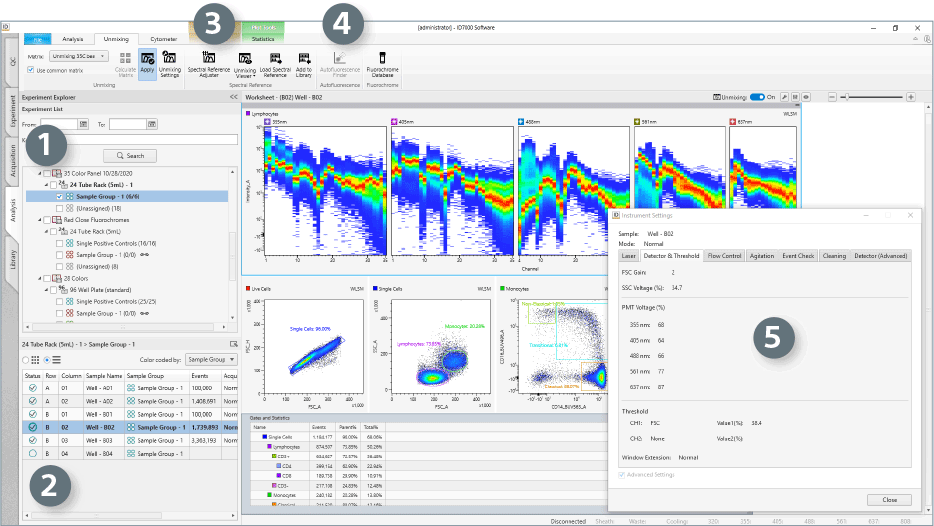
Analysis operations can be performed using the Analysis workflow tab. The key elements of this workspace include:
- The Experiment Pane displays experimental data as a list and allows search by date and keyword.
- The Sample Layout is available on the Plate Pane, where individual samples can be viewed as a list or map and selected to populate the analysis worksheet.
- The Spectral Reference Adjuster is used to optimize unmixing results when needed, by adjusting the spectral signatures of the single-color controls.
- The Autofluorescence Finder Wizard can be used to locate and subtract autofluorescence contribution from the signals of the experimental sample.
- The Instrument Settings Window displays the laser power, voltage, flow rate, agitation mode, and acquisition monitoring settings for each sample.